One month of Google Analytics told me more about our business than any pitch I could have written.
I still have the dashboard. October 3 to November 2, 2011. We were barely past our first year. I look at it now the way you look at an old photo of yourself. A little embarrassed by the haircut, glad someone took it.
The month in one screen
- 44,111 visits from 26,540 people
- 163,950 pageviews, an average of 3.72 pages per visit
- 4 minutes 19 seconds average time on site
- 59.7% bounce rate, 53% new visitors
- Traffic from 68 countries
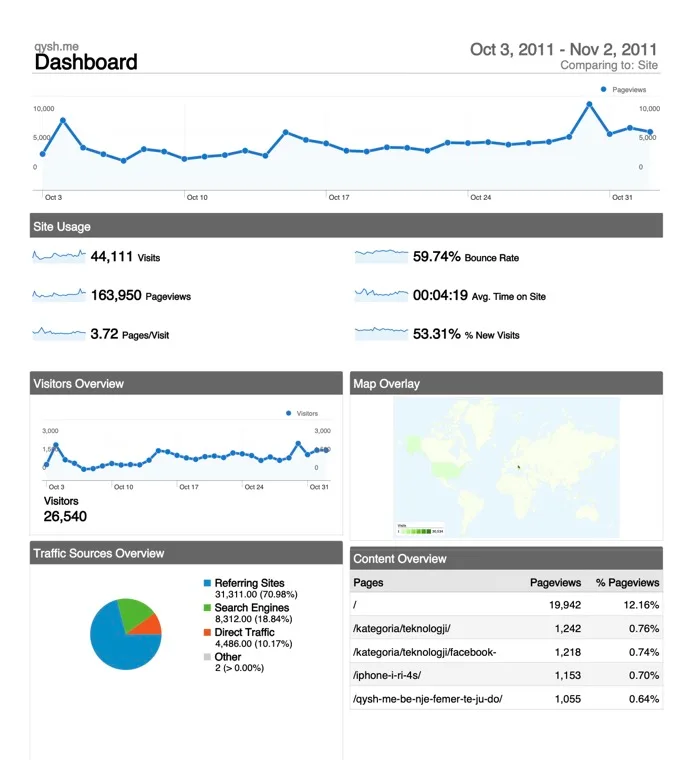
Two people, nights and weekends, a how-to site in Albanian. Nearly four pages per visit and four minutes on the page. That was the number I cared about most.
People were not landing and leaving. They read something, then read the next thing.
Where the readers came from
The traffic sources were the honest part. Referring sites were 71%. Search 19%. Direct 10%.
Inside “referring,” one name ran the show. Facebook sent 54% of all our visits. Google organic was a healthy 17%. And, very much of its time, the link shortener adf.ly sent another 10%.
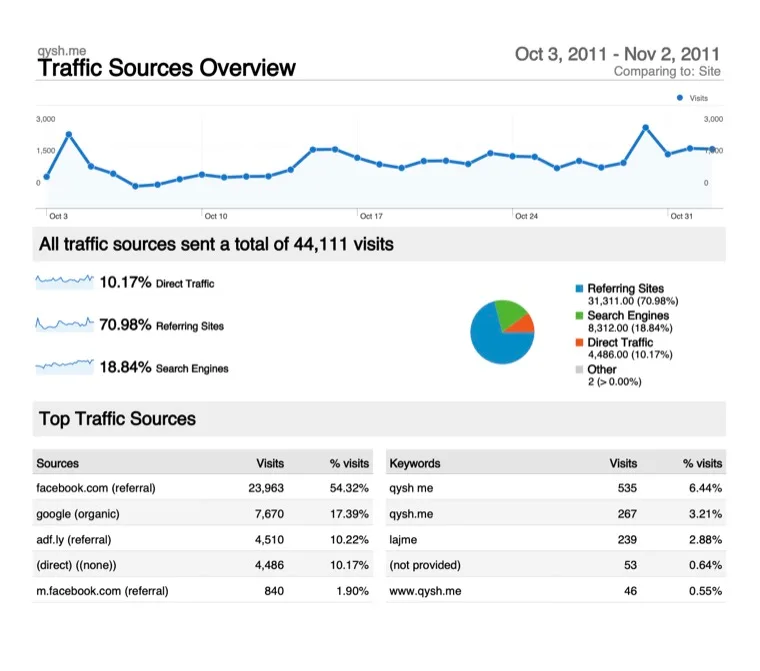
That mix told me where we actually lived. We were a Facebook-native publication that also ranked in search. Not a search property that happened to have a page.
That is why so much of my energy went into the feed, not just the sitemap.
The geography lesson
The country table came with an asterisk that meant everything. The top row said Serbia, 30,534 visits.
It was not Serbia. It was Kosovo. The analytics and IP databases of that era routinely filed it under Serbia. Below it sat Albania (6,109) and Macedonia (1,942), then a diaspora tail through the United States, Germany, Switzerland, Italy and the UK.
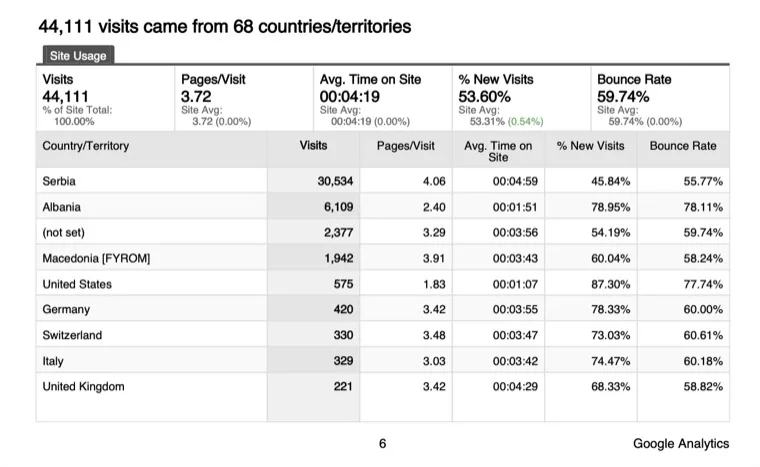
So the map was one story. Albanian speakers, at home and abroad, finding content in their own language. The entire thesis of Qysh Me, sitting in a table, mislabeled by a country code.
Why I keep the screenshot
One month does not prove a business. But this one showed me the shape of ours before I could put it in words.
Read deeply. Arrive mostly from Facebook. Come back by name. Belong to a community the internet had not properly counted yet.
Everything we did afterward, the mobile-first redesign, the writer community, the cooking section, was really just an attempt to serve the people already showing up in that report.
Here is my advice. If you are early and unsure what you are building, go read your own analytics like a stranger would. Ours was quietly telling us who we were.
Write a comment